Aggie Data Science Club semester research project
Sparse Linear Image Modeling
I proposed and led a six-member team exploring how to reconstruct recognizable images with a limited number of strategically selected linear strokes. We combined image preprocessing, Canny edge detection, geometric feature engineering, classification, and optimized stroke placement to identify useful edge indices and balance visual reconstruction quality with computational efficiency.
Overview
The project explored how to reconstruct a recognizable image with a limited number of linear strokes while balancing visual accuracy and computational speed.
Approach and Methods
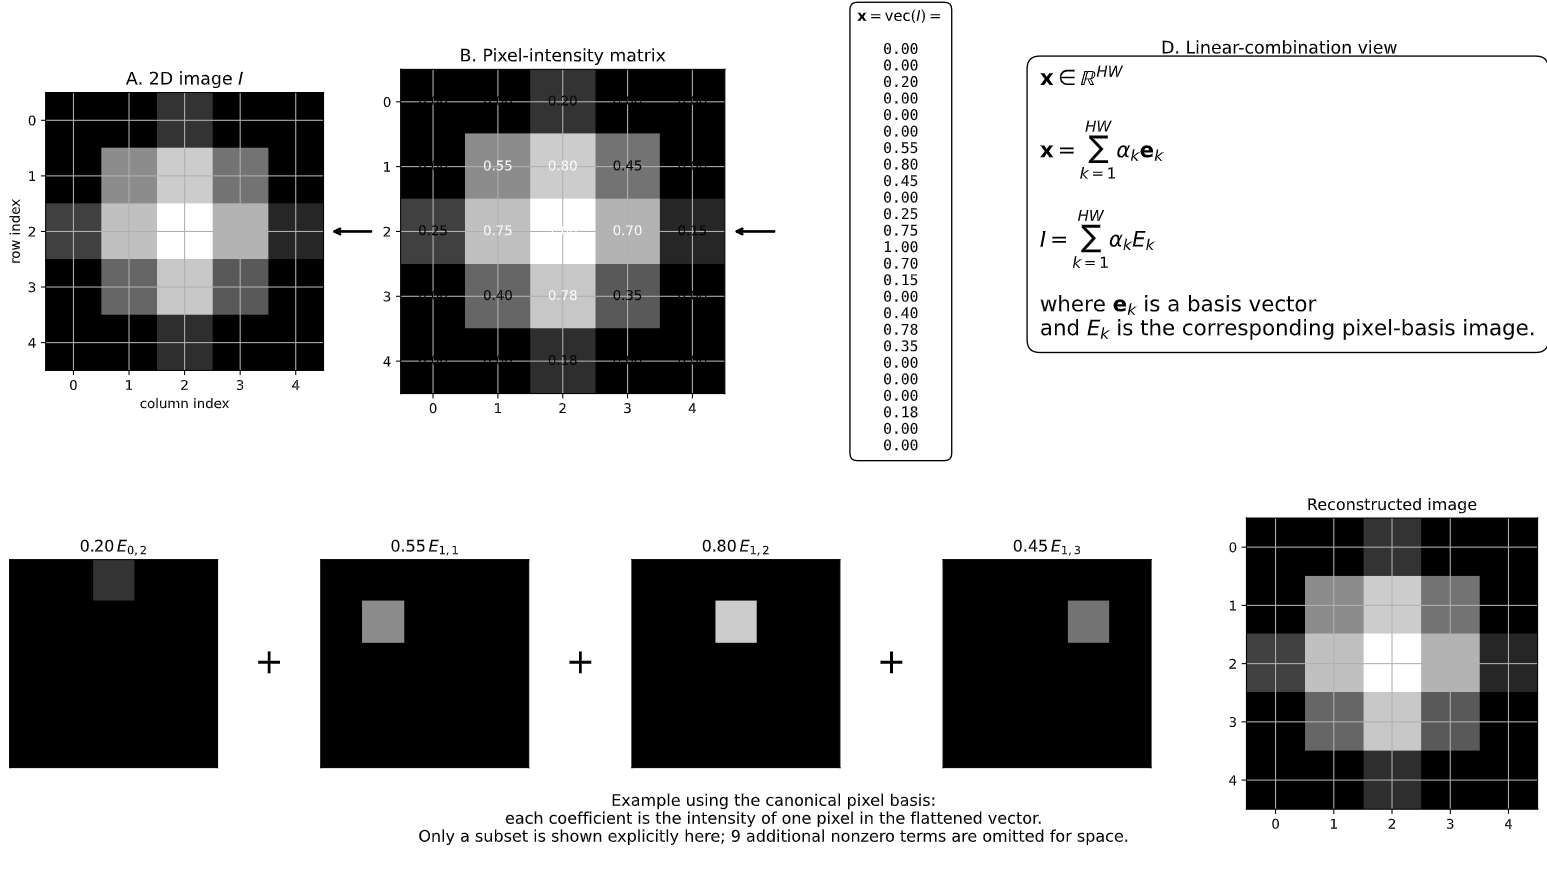
The reconstruction pipeline began with image processing. We converted each image to grayscale and detected its edges using Canny edge detection with deliberately low upper and lower hysteresis thresholds. We selected low thresholds to preserve as much visual information as possible for the later classification stage.
We then needed to generate training data for our models. Using the detected Canny edges, we devised a brute force reconstruction algorithm that sampled more than 300 combinations of stroke lengths, angles, and coordinates. Each candidate stroke was evaluated using two custom scoring metrics.
Scoring Metrics
Score 1: Objective Score [−600, 300]
- Each pixel landing on an edge detected by Canny: +1
- Each pixel landing on whitespace or an area not identified by the Canny filter: −2
Score 2: Proportional Score (0, 1]
The number of stroke pixels landing on a detected edge divided by the magnitude, or total length, of that stroke.
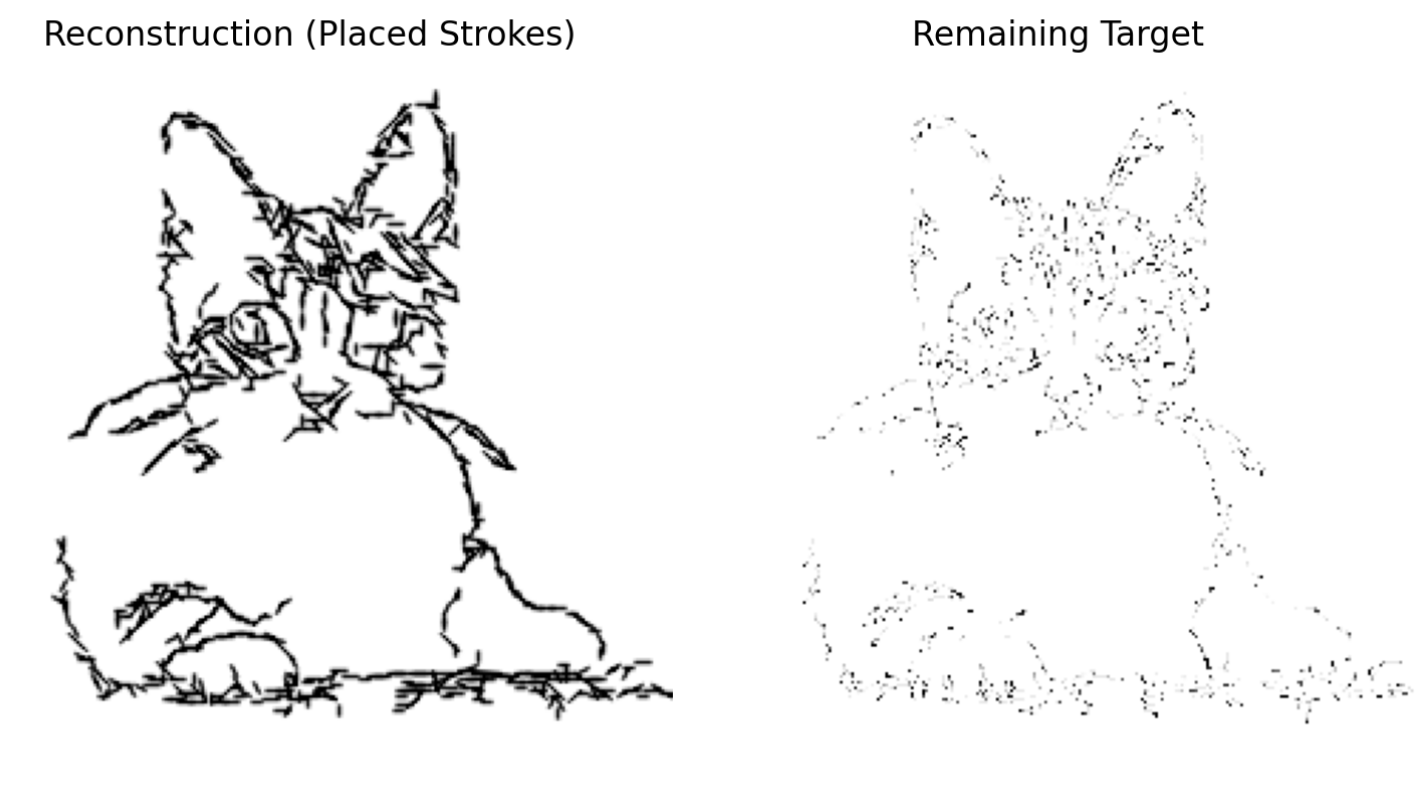
The brute force algorithm evaluated the possible stroke combinations, created a complete candidate set, and assigned both scores to every stroke.
Next came geometric feature engineering, which allowed us to relate each score to the position and surrounding pixel composition of a candidate coordinate.
Geometric Features
Radial Density
Definition: The number of pixels located within a specified radius of a candidate coordinate.
Reasoning: This feature helps determine whether a pixel is an isolated point of noise or part of a connected visual structure.
Directional Strength
Definition: The number of pixels extending in a given direction from the candidate coordinate.
Reasoning: Pixels with greater directional strength are more likely to belong to a line or defined edge.
Linearity Residual
Definition: Using the method of least squares, this feature measures how closely the neighboring pixels can be fit by a line.
Reasoning: A strong linear fit helps estimate whether drawing a stroke through a particular coordinate would accurately represent the detected edge.
We also wanted to determine whether coordinates with more linear behavior would produce better stroke candidates. We performed principal component analysis on the coordinate level features and scores. Higher scoring candidates exhibited greater directional strength and lower radial density, indicating that these variables were correlated and that a learnable relationship existed.
Using the engineered features and score labels, we selected proportional and objective score thresholds that classified candidate pixel locations as useful or not useful for initiating a stroke. We then trained several classification models, including Logistic Regression, Random Forest, SVM, KNN, and MLP. The models achieved approximately 97% recall on the imbalanced classification task.
The classifier identified useful edge indices more efficiently than random selection and supported increasingly detailed reconstructions using 200, 550, and 1,000 strokes.
Technical Decisions
The team precomputed stroke masks, used proportional scoring, enforced sparsity, performed feature engineering and PCA, and compared several classification models including Logistic Regression, Random Forest, SVM, KNN, and MLP. We achieved approximately 97% recall on the imbalanced classification task.
Result
The classifier identified useful edge indices more efficiently than random selection and supported increasingly detailed reconstructions at 200, 550, and 1,000 strokes.
Lessons Learned
Strong numerical results must also make visual and practical sense. The team examined errors, revised assumptions, designed stronger features, and tested again when early approaches underperformed.